Conferences
Couldn’t attend Green IO London?… Ned got it covered for you
The stated intention of the conference was to strike a balance between a focus on where digital sustainability can bring co-benefits with financial cost (and hence be 'good for business') but also where the ‘limits’ of sustainable ICT are - especially with the rapid adoption of AI.
And I think that balance was broadly struck, with no hint of greenwash in the process. Which is actually quite a rare feat, based on my experience of some other conferences and events on this topic I have been to in the last couple of years. So bravo, Gaël DUEZ, Sandra Sydow and the whole team for putting together a roster of really great examples of practical sustainability in action in both private and public sectors!
The following write-up goes session-by-session, covering those which I found particularly inspiring and useful, and highlights a 'key takeaway' for each. The first 7 are from outside of government, and then the following 5 all focus on work being done in the UK public sector!
Wrap Up Article
TALK: ”Good for the Planet, good for the wallet: how Al can heat our water"
Charlie Beharrell gave a talk about the work heata are doing, along with Mark Buss from OVO Energy.
KEY TAKEAWAY: A model that distributes data centre infrastructure by placing servers in people's homes and recycles the waste heat from compute to produce hot water can be good for business and good for planet.
The problem
Demand from commercial data centres is rising fast, and the electricity grid will struggle to keep pace with this growth. At the same time, homes and offices are looking for greener ways to heat themselves.
While moving heat is hard (without pre-existing heat networks and piping), moving data is relatively easy...and getting easier all the time as networks and connectivity improves.
![]()
Figure 1: Heata's slide on 'Infrastructure: levers for reducing carbon emissions'. They highlight heat reuse as the 'next frontier'.
The solution
Heata have a vision for placing data centre servers in people's houses and offices, and recycling the heat produced to make hot water. A new kind of digital infrastructure that is more efficient, ethical, and faster to build.
‘Let’s take the processing to where heat is needed. Let’s puts servers from data centres in people’s homes’ Charlie Beharrell
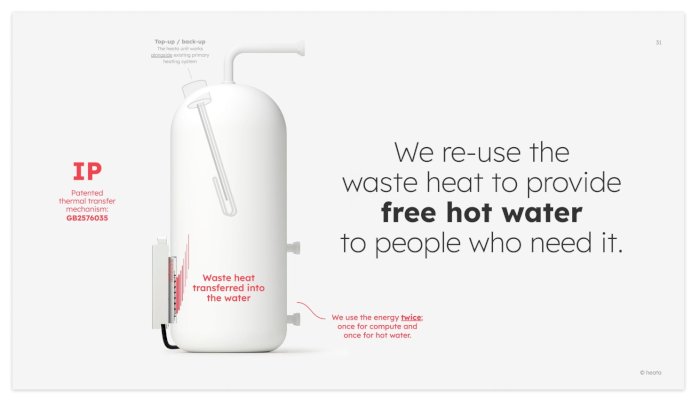
Figure 2: Slide from Heata talk, GreenIO London, September 25th 2025
Workloads
Heata run workloads that are: portable, CPU/GPU intensive as those produce more heat, and can be run anywhere (containerised e.g. k8s). The types of workloads are things like:
- AI / ML - Data Science Inferencing, Hyperparameter tuning
- Batch Processing - Monte Carlo Simulations or 3D Rendering
- CI / CD (Continuous Integration and Continuous Delivery/Deployment) jobs - building, testing and deployment of software
Case Study
Heata have run a Pilot, with CarbonRunner to take OVO's CI/CD jobs and run those on servers placed on boilers in people's homes. The results are summarised on the 'What did we learn?' slide (Figure 3).
In essence, Ovo suggest that the Heata model is good for business as it lowers customers' gas bills, starts them on a decarbonisation journey and they pay less for cloud compute. At the same time, its good for the planet as it reduces customer heating footprint and contributes to the UK moving away from gas.
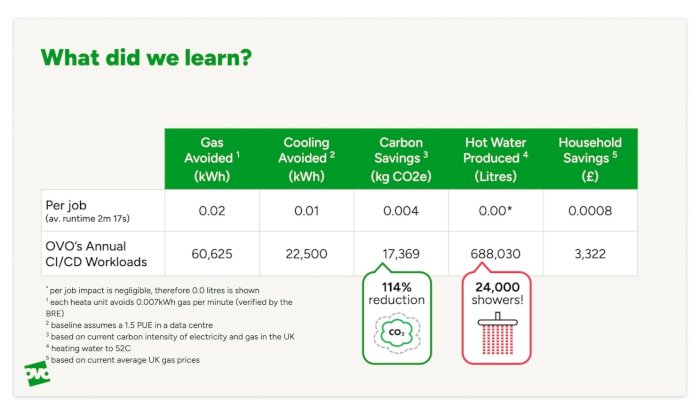
Figure 3: Slide showing the learnings from the pilot between Heata, OVO energy and Carbon Runner.
Heata uses the energy twice; once for compute and once for hot water.
PANEL DISCUSSION: 'Can networks keep up with the AI boom? A 2030 discussion'
Oliver Cronk facilitated a panel session with Benjamin Schwarz, Dom Robinson, and Ioannis Kolaxis entitled "Can networks keep up with the AI boom? A 2030 discussion”.
KEY TAKEAWAY: Networks are 'on' all the time and set up to cater to peak traffic. If we want to reduce the energy consumption of networks, we need to think about reducing peaks, and then network capacity may follow.
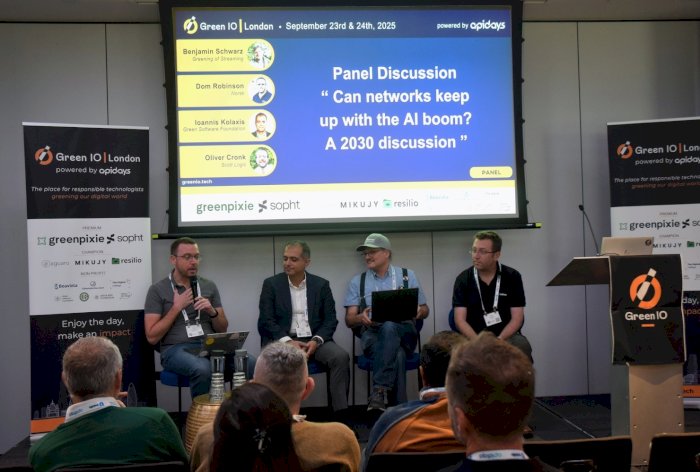
Figure 4: The panel, featuring (L-R) Oliver Cronk, Ioannis Kolaxis, Benjamin Schwarz and Dom Robinson
The panel explained that as the network is 'on' all the time, the 'use less data model' doesn't make any difference to its energy consumption. Networks are set up to cater to peak traffic, so if we want to encourage network operators to spend less money on setting capacity so high to cater to these peaks, then we need to think about how to mitigate those peaks.
"With networks, your energy consumption is not linked to your usage." Ben Schwarz
Our commercial relationships with operators have been, for the last 40 or so years, ‘all you can eat’. This is a problem. If operators could offer variable bills, according to usage, this would help us all as users get a sense of the varying energy consumption.
The panel also discussed that at present, streaming content (such as films and music) dwarfs the traffic linked to AI's mainly text-based interactions. However, if generative AI heads in the direction of video generation, that may create problems for networks and drive up demand significantly to 2030 and beyond.
TALK: "Forget SkyNet, will the energy consumption of AI destroy humanity?"
Anne Currie gave an interesting talk on AI and our future, in which she asked what the main levers are for reducing the environmental impacts of AI.
KEY TAKEAWAY: The main lever we have for making AI more 'sustainable' is to align it with renewable energy generation. Efficiencies and arguing against its use can't do so alone.
Strategies that are not so useful...
- Anne suggested that arguing against the use of AI is a hard, and perhaps impossible task. What with ChatGPT being the fastest adopted technology that humanity has ever seen.
- Efficiency is not really going to get us there either - we have not hit ‘diminishing returns’ yet for increasing compute and with it the ‘intelligence’ of AI. The 'brute force' approach to AI in the US means data centre building is accelerating, and energy demands keep going up and up. When many data centres are powered by fossil fuels this is not good!
And one strategy that might work:
The strategy that can help us, Anne argues, is aligning AI and renewable electricity. This is how AI can become 'sustainable' in a meaningful way.
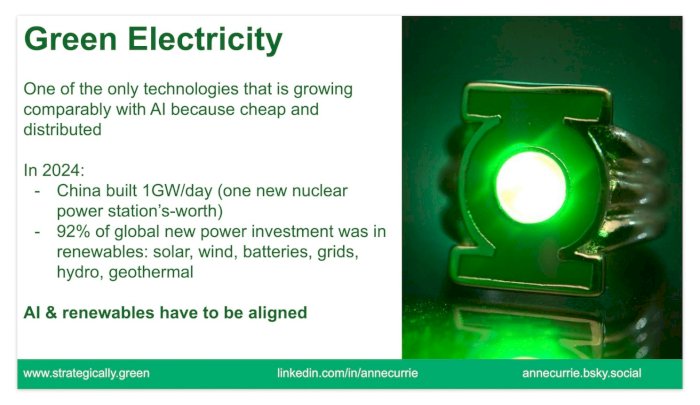
Figure 5: Slide from Anne Currie's talk on Green Electricity and its growth
We are seeing strategies to do just this in some parts of the world. In China, there is the notion of 'east data, west computing'. This reflects that people in the cities in the east of the country produce and consume data, and in the west, there is much more space for data centres and solar and nuclear sources to power them.
India also have a strategy - as the country gets a lot of sun, it makes sense to build out a great deal of solar capacity, and have battery storage for nighttime supply. They combine this with tariffs that encourage daytime use - lower costs during 'solar hours'.
"Alignment of AI and renewable will eventually happen - we need to do what we can to accelerate it". Anne Currie
TALK: "SCI for Web. How we applied the Software Carbon Intensity (ISO 21031) standard to the web"
Oliver Winks from Root & Branch gave a talk about adopting a bottom-up model to apply the Software Carbon Intensity spec to calculating the energy use of web apps and sites.
KEY TAKEAWAY: Using a bottom-up model to apply the Software Carbon Intensity spec to estimate the energy usage and carbon footprint of websites and apps can provide us much more granular, and actionable estimates than top-down models.
What is the SCI?
The Software Carbon Intensity (SCI) spec describes a methodology for calculating the rate of carbon emissions for a software system…its formula covers both the ‘energy that the physical hardware consumes and the emissions associated with manufacturing the hardware.’ It is now an ISO standard.
What is the web model that Root & Branch have been developing?
The work that Root & branch showcased is all about taking the established SCI methodology and expanding it to cater to the specifics of to websites and applications. They have produced what they have termed the ‘Cardamon Web Model’ (CWM) in order to do this.
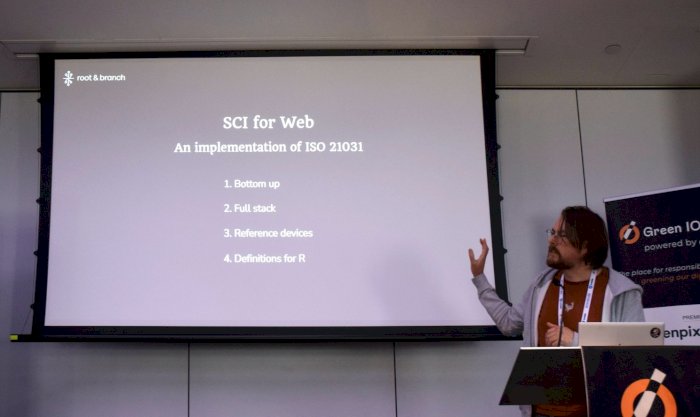
Figure 6: Oliver Winks presenting the 'SCI for Web' model that Root & Branch have developed.
The CWM specifies exactly what the operational and embodied carbon emissions for a software system, as expressed in the general SCI formula mean for a web application or site. This model:
- Is bottom-up, which means it takes a series of measurements of different parts of a system and then adds these together to build a picture of the whole. (This is the opposite of top-down models, such as the Sustainable Web Design Model, which provides an estimate of energy usage, based on page weights in bytes, coming from page loads only. This takes an estimate of the total energy of whole internet, and then try and apportions that in terms of that proxy measure).
- Is full stack, which means focuses on the whole range of devices involved in the fetching and rendering a website, from end user devices through to the infrastructure running in the cloud. (They are working on applying the SCI for cloud in a separate paper that will be shred in due course!).
- Makes use of reference devices, in both the end user and server (data centre) cases. This is to provide data for hardware where it is not available.
Provides definitions for ‘R’, which is the functional unit, such as energy usage ‘per user journey’.
The team have written up this methodology in a paper which you can read here: Oliver Winks, Adam Newman, Son Ba Pham Root & Branch Digital Ltd, ’Software Carbon Intensity (SCI) For Web Measuring energy and emissions of web applications’, August 2025
How is the model applied in practice?
The model is applied as follows, as shown in Figure 7.
- Load website on reference device. Look at market data, and see what devices people are typically people using
- Interact with the page - these user interactions can be anything from a simple page load, scrolling, to adding items to a basket, processing a purchase, reading an article, watching a video, or playing a game. Then take those user journeys and implement them as scriptable tests, running them across a representative sample of pages from a website (or sub section of a site).
- Whilst doing Step 2, gather metrics on the end user device, such as CPU utilisation, GPU utilisation, what is the network adaptor up to, how much data is being sent and receiving.
- Repeat!
- Collect cloud usage metrics.
- Apply energy functions to the metrics that have been gathered, and add up energy values for all the components.
- Scale energy values via user analytics. For example, how many users have arrived at a particular route, how many users are accessing the website from particular regions, carbon intensity of said region etc.
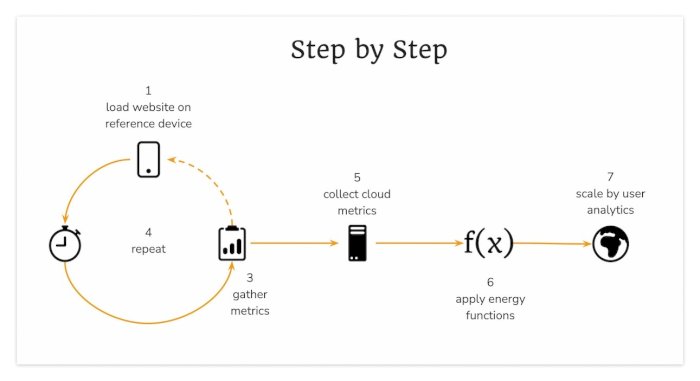
Figure 7: The Cardamon Web Model application
The result
The assessment done via the Cardamon Web Model can provide estimates in terms of the 3 main 'segments' - front end, back end and networks, as in the example in Figure 8. Websites end up with a Greenhouse gas protocol-aligned report and website energy efficiency rating.
The relative spread between these 3 segments will be significantly impacted by the 'shape' of websites. In Figure 8, the bulk of the emissions (83%) came from the front end, as this was a marketing website, with millions of hits, and very little going on in the cloud, on the backend. For some websites the profile could very well be the opposite!
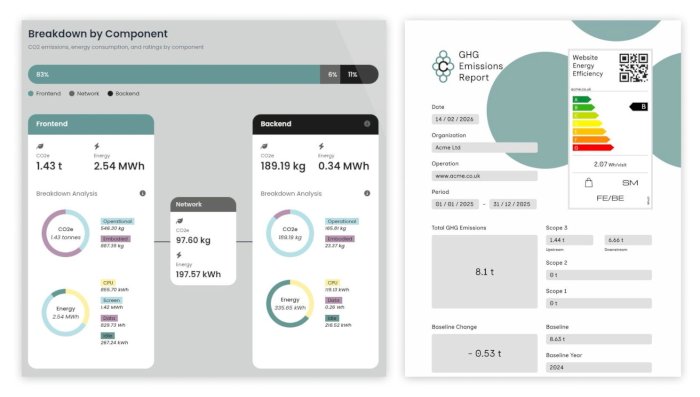
Figure 8: The breakdown by component shown on the left, and the GHG emission report with energy rating shown.
Because of the bottom-up nature of the model, it can show what exactly is consuming all of the energy, and helps target action on what can be improved - it helps devs take action!
TALK: 'Sustainable CI/CD: shifting compute tasks where CO2 intensity is the lowest'
Dryden Williams from CarbonRunner invited us to think about the potential environmental impacts of moving portable workloads from one region to another.
KEY TAKEAWAY: We can move portable workloads from high carbon, water stressed regions to low carbon and water stress ones. And this can make a big difference!
The problem
Some regions from the large cloud hosting providers are classified as ‘low carbon’. In reality this classification is often based on power purchasing agreements (PPAs), rather than the electricity that is actually consumed in that location.
Dryden told us that 90% of the world’s data centres are in regions with high fossil fuels, such as Virginia in the US.
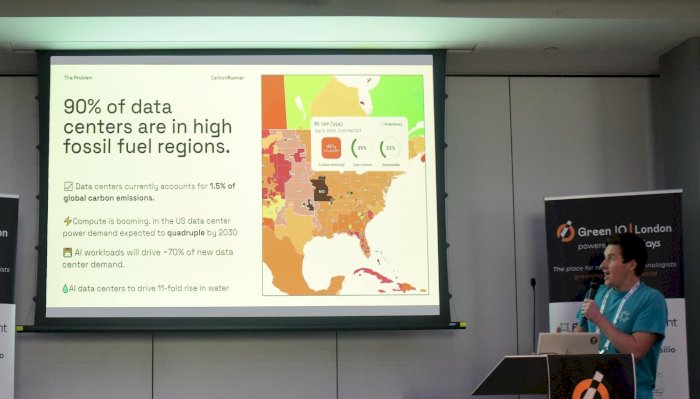
The solution
With portable jobs, Carbon Runner want to prioritise the regions, and the hyperscalers, who are doing great work in sustainability.
They look at availability across cloud providers, and look at how carbon intensity ebbs and flows, and see where the underutilised servers are and use those. Carbon Runner currently uses mostly region level data, as individual data centre data is mostly not available at present.
For example, choosing the Quebec region, which has hydro power rather than coal-fired power stations, over Iowa would save 93% of Carbon emissions on the workloads.
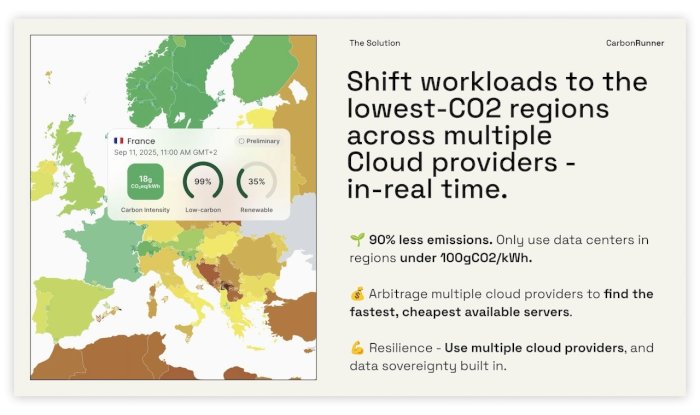
Figure 10: The impact of shifting workloads to the lowest CO2 regions
Case study
This can be done within the UK as well, with Carbon Runner having worked with Deep Green, where a data centre in Exmouth heats a swimming pool, or with Heata, Shifted OVO’s GitHub actions to servers on home boilers in the UK.
They have focused on CI/CD (Continuous Integration and Continuous Delivery/Deployment), and shifted workloads of GitHub actions, but also batch processing, video rendering, AI training etc from one region to another.
TALK: "How carbon.txt enables transparency across tech companies"
Hannah Smith from the Green Web Foundation gave a talk about the potential of companies hosting a carbon.txt file on their websites.
KEY TAKEAWAY: Understanding what environmental targets and goals a tech company has set is hard - a machine-readable carbon.txt file hosted on websites could help with consistency, discoverability and transparency.
The problem
Understanding what net zero and other environmental targets (including interim ones) a company has set is difficult. Even when data is published it is not always easy to find. When the Green Web Foundation did research on this, this was very time consuming and its ahrd to know what data can be trusted.
The solution
Hannah talked about the idea of having a carbon.txt file, in order to make organisation's pledges and goals understandable and discoverable, data that can be read by machines, so then we have data that we can use.
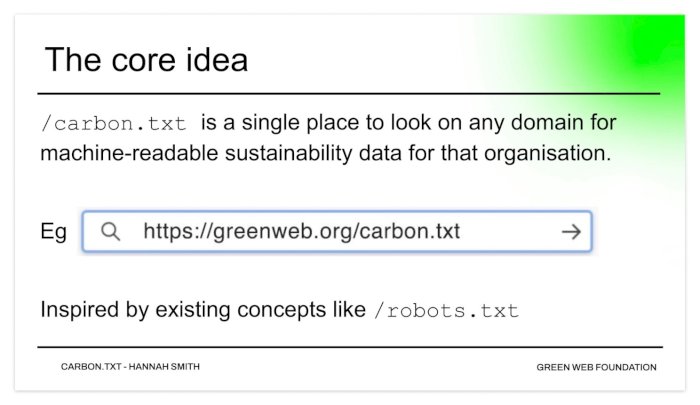
Figure 11: The core idea of carbon.txt
Use cases are shown in Figure 12:
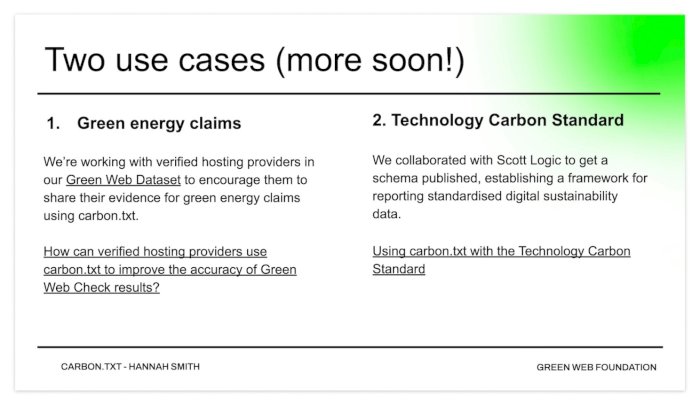
Figure 12: 2 current use cases for carbon.txt
TALK: "GreenIT is good but it’s not enough!"
Ian Brooks gave a talk on how the concept of 'Green IT' has evolved over the decades, and why we might need to expand our gaze beyond simply reducing negative impacts.
KEY TAKEAWAY: ‘Green It’ is good…but not enough. We need to get better at seeing the bigger picture of how digital technologies are applied and ‘talk about the damage’ that ‘tech for bad’ is doing.
Until now, Ian suggests, we’ve tended to think quite narrowly on how we can reduce the impacts of technology - of ‘greening’ it. At the same time, we’ve often focused on those particular use cases where technology has been applied to bring about net-benefit. For example AI to monitor forest cover or spot diseases earlier.
But IT is not all 'for good'. Ian suggests we need to get better at ‘talking about the damage’ done where ‘tech for bad’ occurs. One example he gave is enabled emissions, which are ‘the additional greenhouse gases released when AI, IoT, and cloud computing make more fossil fuel production possible’.
![]()
Figure 13: 'Talking about the damage'
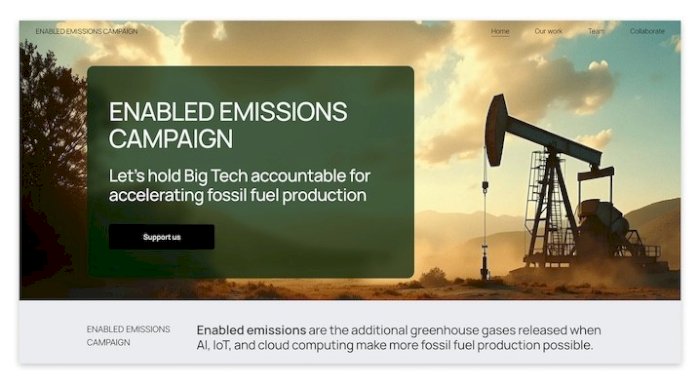
Figure 14: The Enabled Emissions Campaign
Not to mention, all the ‘frivolous’ use of these technologies, to create individualised, targeted marketing content and sell things.
Ian suggests it is perhaps our duty as designers, developers, managers to think about those companies, or applications of technology that we won’t support, and that we won’t work on. What will you stop doing?
TALK: '3 concrete success stories from Defra'
Tom Parry, the head of Digital Sustainability in Defra (Department for the Environment, Food and Rural Affairs), talked us through 3 recent, concrete sustainability success stories.
KEY TAKEAWAY: Utilisation of second life end user devices (‘refurbished by default’) can deliver huge carbon savings in terms of the embodied impacts of manufacturing and distributing new devices.
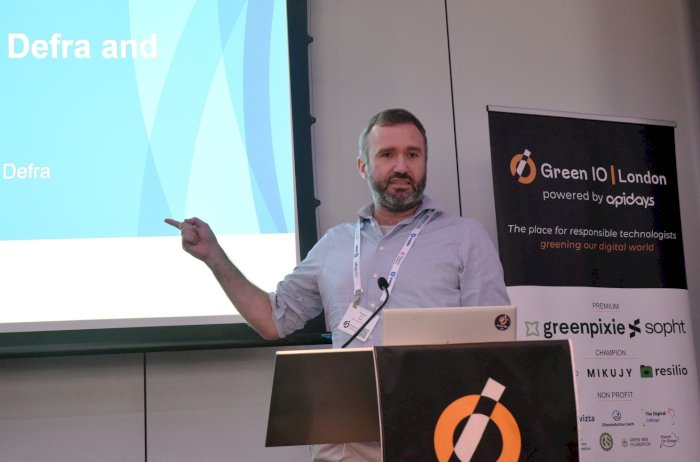
Figure 15: Tom Parry from Defra talking about 3 success stories from the department
1. AI Position Statement and Guidance
Defra has developed an AI position statement, describing how the environmental impacts of the technology will be considered. (See figure _). This is complemented by detailed guidance on how this can be actioned, covering the selection and training of models through to efficient usage and measurement of environmental impacts.
These principles have already been put into practice on a wide range of different sorts of projects in the department. These include a Proof of Concept on using AI to help farmers navigate much more quickly to the advice, and the funding, that is relevant and applicable to them. For that project, a full environmental impact analysis was conducted, comparing the AI-powered process against the ‘as-is’, which demonstrated net environmental savings and benefit from the use of AI in this way.
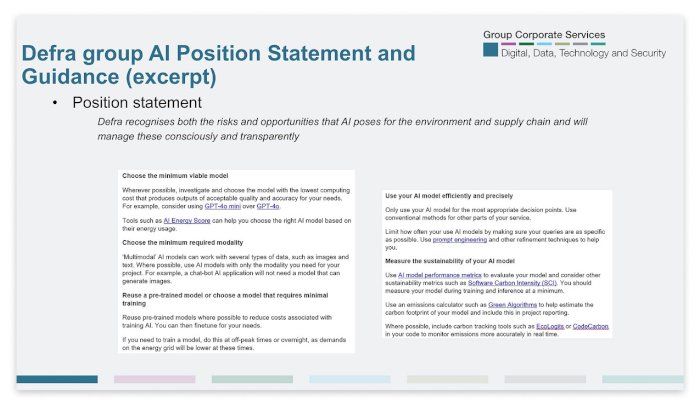
Figure 16: A slide showing Defra's AI Position Statement and Guidance
2. End user devices to be ‘refurbished by default’
Defra has a new contract for end user devices, such as the laptops and peripherals that civil servants in the department use. And this features a new model where devices will be refreshed based on their performance degradation (i.e. when they are no longer working well) rather than at fixed time interval. At the same time, there is a ‘refurbished by default’ approach, where colleagues will receive a second life device as standard. But these will look and perform as if they were new!
Each refurbished laptop saves approximately 316 kg of carbon compared to manufacturing a new one. In addition, using smart lockers for sending out laptops, rather than delivering them to people’s houses delivers about a 75% saving of carbon.
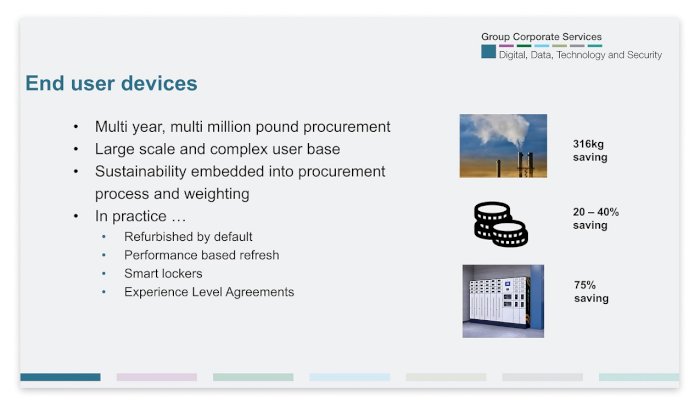
Figure 17: A slide on Defra's End User Devices procurement
Read more on this: https://defradigital.blog.gov.uk/2025/09/30/how-defra-is-leading-the-way-in-sustainable-technology/
3. Clear strategy and practical advice
The third success story that Tom pointed to is all the work that is currently underway in the department to develop new strategies and practical advice on various aspects of sustainable services.
A new Defra Digital Sustainability Strategy is being developed alongside one for the UK government as a whole. The team is also working hard on an array of guidance, tools and processes to empower busy digital service teams understand what sustainability actions are relevant for their context, and then how to going about taking these.
PANEL DISCUSSION: ‘Implementing the Gov AI playbook: trade-off from the trenches’.
Ishmael Burdeau from DWP chaired a panel made up of a trio of civil servants to discuss ‘Implementing the Gov AI playbook: trade-off from the trenches’.
TAKEAWAY: ‘Digital sustainability as ‘business as usual’ is where UK government is heading…and that includes AI!
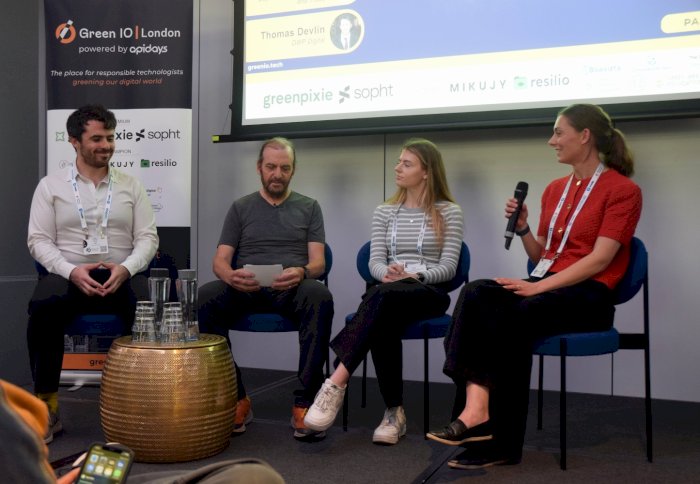
Figure 18: The panel, L-R: Tom Devlin, Ishmael Burdeau, Sophie Thomas and Lydia Tabbron
Thomas Devlin from DWP Digital talked about the AI Playbook for Government, and the work done to create a new section on using AI more sustainably. He described that the majority of power consumption tends to come from training AI models, and so the content in the Playbook has been developed to help people understand the likely environmental impacts upfront, and what can be done to reduce these.
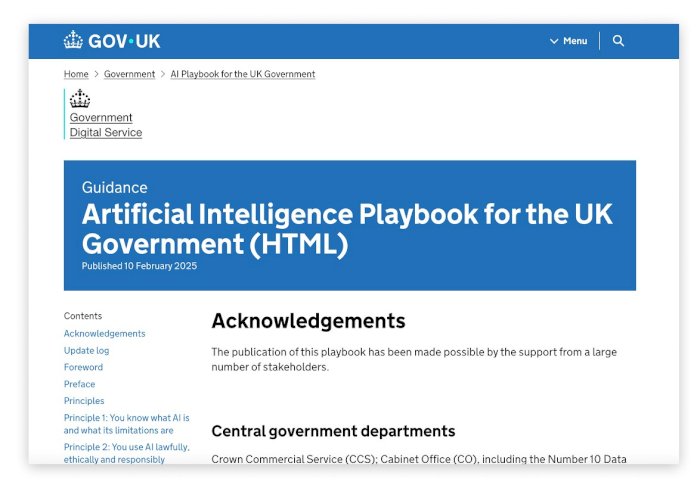
Figure 19: A screenshot from the Artificial Intelligence Playbook for the UK Government, published February 2025
Lydia Tabbron from the Digital Sustainability team in Defra talked about the ‘Government Digital Sustainability Alliance’ (GDSA) that she coordinates, and how the work of this body has fed into the AI playbook. The GDSA is a grouping of digital suppliers, academics and third sector organisations that advise UK government on how to make their ICT, estate and supply chain more sustainable. Lydia explained the unique range of perspectives the GDSA brings into the room, ranging across smaller players, SMEs, NGOs, academics as well as the large corporates. This diversity served to supercharge the formation of a GDSA AI working group in early 2025, which then fed into the work on the AI content for the Playbook.
Lydia also talked about the new Government Buying Standards, which set minimum sustainability requirements for government procurement, and are currently out for consultation. One of these standards focuses on AI.
“Sustainability as ‘business as usual’…that is the direction we are headed in, as a government. The new Government Buying Standards reinforce that message.” Lydia Tabbron, Defra
Daisy Thomas, from the Department for Business and Trade, talked about work she has led to evaluate the impact of giving civil servants access to Microsoft Copilot, particularly focused on efficiency and productivity. In terms of benefits, the study does show some modest time savings, for example in terms of making notes from meetings. However, assessing productivity is challenging and time savings do not mean that the organisation as a whole will automatically become more productive. For quantifying environmental impacts, there is still a challenge around getting the right data from suppliers, so when more data becomes available, they will be able to improve estimates.
Figure 20: Microsoft 365 Copilot pilot: DBT evaluation report, published 28th August 2025
TALK: ‘Click, log in, carbon down: the sustainability journey of GOV.UK One Login’
Jennifer Marks, Head of Digital Sustainability in Government Digital Service talked about the digital sustainability journey of the ‘One Login’ programme - which is a digital identity authentication system that acts as a single sign-on for UK government services.
KEY TAKEAWAY: GreenOps really can bring win-wins for sustainability and cost…and we can evidence this with the right housekeeping and rigorous approaches to measurement.
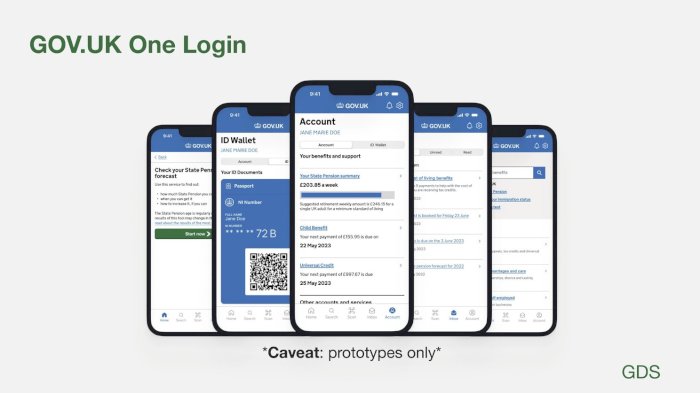
Figure 21: One Login slide from Jennifer's talk, showing GOV.UK app prototypes
Sustainability work on the One Login programme has focused on ‘GreenOps’ - ranging from things like changing processor architecture to introducing step-scaling. A large part of the challenge has been how to quantify the environmental impact of the actions that have been taken, and Jennifer described 3 ‘rounds’ of work on this front.
ROUND 1 - Applying best practice, tagging usage
The programme began by applying best practice as expressed in the AWS Well Architected framework and principles. The dashboard provided by AWS allowed some sight of the impact of this, although in order to get meaningful data, One Login activities needed proper tagging, and so a rigorous tagging schema was put in place - a reminder of the importance of good housekeeping when it comes to accounting for sustainability impacts!
ROUND 2 - Getting granular with GreenPixie, evidencing the win-wins
In order to develop a more detailed baseline for the carbon footprint of One Login, the programme next worked with Greenpixie. This involved taking AWS cost and usage data to estimate One Login’s cloud energy usage, and from that build a profile for carbon emissions and water consumption too.
They present an optimisation work between February and June 2024 then served to significantly reduce cloud carbon emissions. This work demonstrated that Greenops is not just good for planet, but can reduce costs as well, as it has helped save 47% of AWS cloud spend!
ROUND 3 - Going full lifecycle with GoCodeGreen
One Login then worked with GoCodeGreen | B Corp™ to undertake a lifecycle assessment of the service’s environmental footprint. This covered the whole system - from cloud usage, software, deployment, networks and end-user devices, and benchmarking was done with Software Carbon Intensity aligned metrics. For the first time they were able to see the whole impact, and have an estimate of the carbon per user login - 54 gCO2e. (See figure 22).
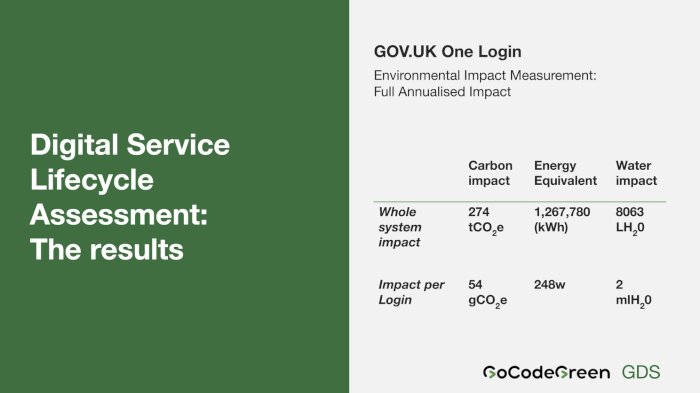
Figure 22: Digital Service Lifecycle Assessment
Now, the team is focusing on sustainable maintenance, and keeping sustainability at the heart of the platform strategy !
TALK: "Beyond the Digital Sustainability Bubble – Nudging Strategic Change in 90 Days"
One of the highlights of the conference for me was Steven Chinnery from DWP Digital speaking about an interactive workshop he has developed to help service teams identify and prioritise the sustainability action they can take.
KEY TAKEAWAY: Lots of people want to do the right thing when it comes to digital sustainability, but its vital we focus on awareness and capability to make sure action follows this desire.
The problem
Identifying best practice is one thing, but upskilling a whole government department so teams feel able and ready to take action is quite the challenge!
When Steve and co piloted some Climate Fresk workshops in DWP, the feedback that they gathered was that colleagues had a good deal of desire to put digital sustainability into action, but that they found it ‘overwhelming’, ‘complicated’, ‘too abstract’ and a number of other things. (Figure 23).
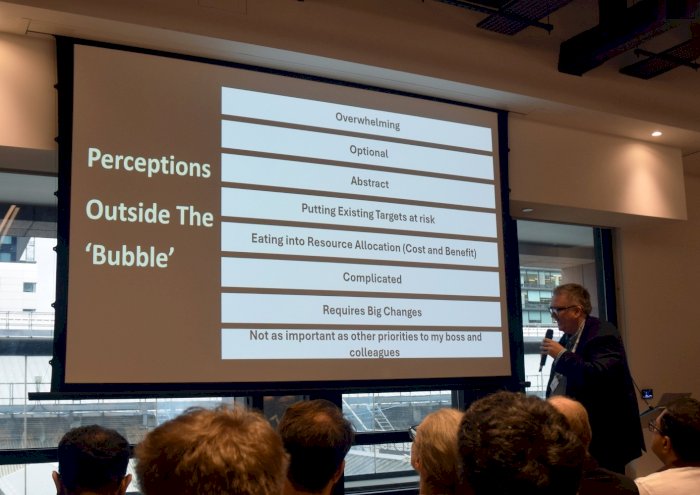
Figure 23: Steve Chinnery describing the challenges faced by service teams in DWP on putting digital sustainability into action
Solution
So Steve and co came up with the idea of a 90 minute, interactive card-based workshop, for teams that are building services currently to focus on the ‘art of the possible’ in terms of what actions can be taken in a 90-day window.
The workshop format:
The workshop follows the following format:
a.) Categorise team plans for the next 90 days
b.) Explore those plans in detail
c.) Brainstorm where there might be sustainability opportunities
d.) Explore where there these sustainability actions might bring co-benefits, such as cost or usability.
e.) Prioritise sustainability actions
f.) As a team, commit to 3 actions, and shape these into 3 SMART objectives. The idea here is that this creates a ‘psychological contract’ that helps people commit to action.
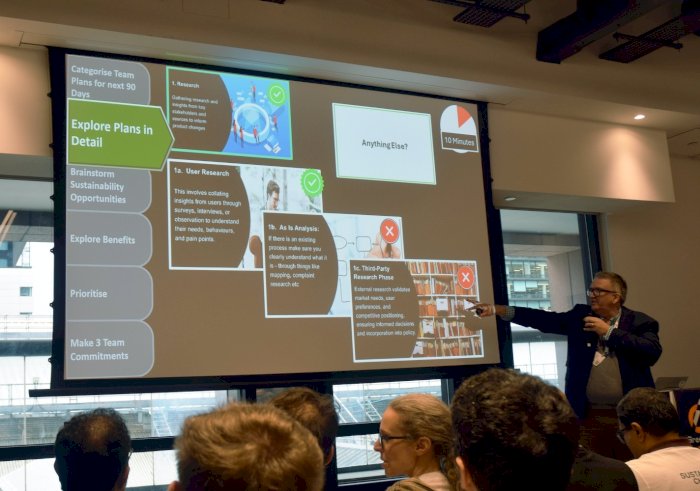
Figure 24: The 90 day sustainability workshop structure
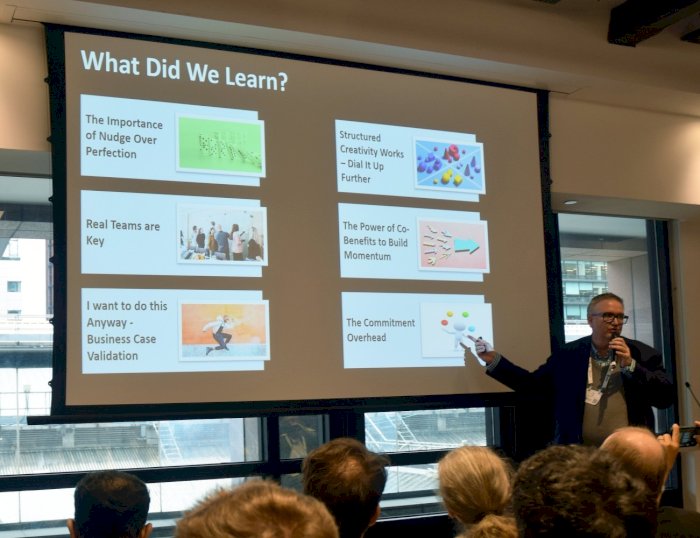
What they learnt
What they learnt is summarised in Figure 25.
This workshop format is currently being iterated having been road tested several times recently!
TALK: 'Climate change is here - using a systems thinking approach to keep the NHS resilient'
Ben Tongue, Greener Digital Lead for NHS England and Claire Robinson, Sustainable Business Director for Transform spoke about the ‘systems mapping’ work they have done to understand how to maintain digital services that are resilient to climate risks.
KEY TAKEAWAY: Climate adaptation and resilience requires bringing a systemic lens, and while it may be an affective 'way in' to the topic of digital sustainability for leaders, there may be tensions with mitigating emissions.
The resilience of digital services may be an ‘embryonic’ topic…but as Ben pointed out, supplementary Green Book guidance from April 2025 tells us that we are obliged to consider ‘accounting for the effects of climate change’ and ‘every business case now needs to build in risk mitigations for a 2 degrees hotter world’.
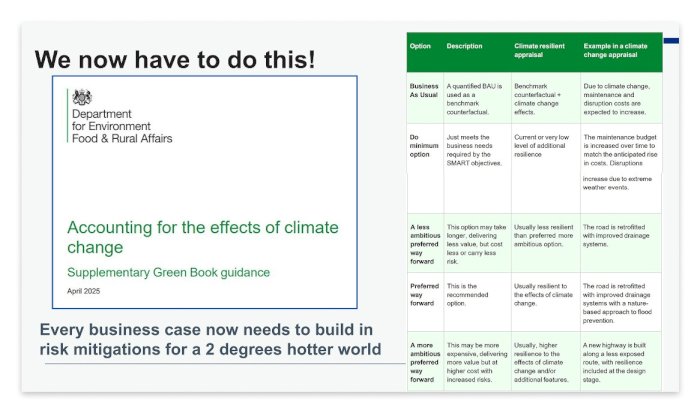
Figure 26: Green Book guidance on business cases
The challenge of understanding resilience
However, this presents a challenge: how can we cost in to business cases the effects and risks of a 2 degree world? How do we 'boundarise' these problems of resilience, in complex systems…so that we can meaningfully do something about it?
Ben and Claire explained how that they sought to answer those questions through ‘systems thinking’ approaches for the NHS. These began with data gathering and interviews with a broad range of NHS staff and other relevant actors. This insight ultimately fed the creation of a ‘systems resilience map’, which allowed exploration of the knock-on effects and cascades between different parts of the system. The model can be used to make predictions about the cascading impacts of things, such as an increase in frequency of heatwaves. It can then provide a ‘theory of change’, pointing to the actions we can take to help reduce the cascading impacts and failures within the system.
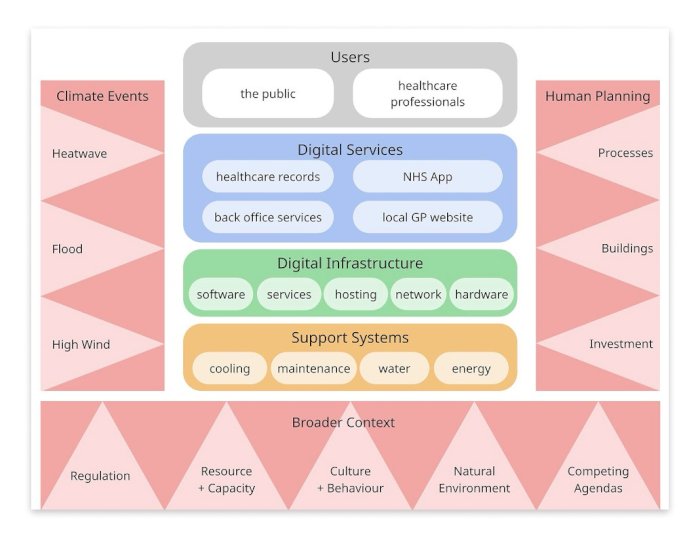
Figure 27: The NHS service ecosystem
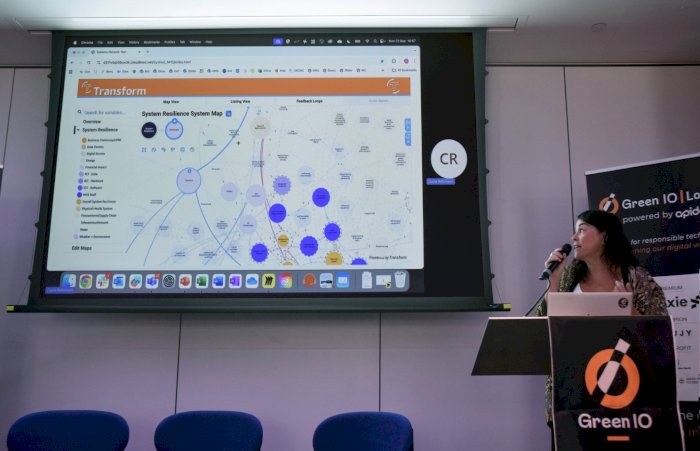
Figure 28: Claire Robinson and the System Resilience Model they created
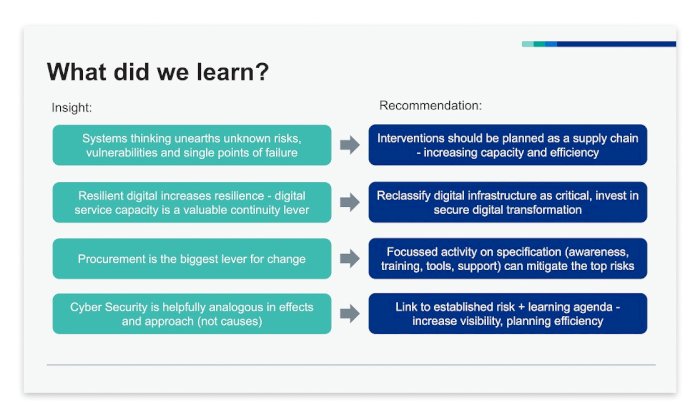
Figure 29: What they learnt!
A couple of questions to takeaway:
- Can climate adaptation and resilience be a better way in for digital and organisational leadership to the whole question of digital sustainability? Climate change is here now and will soon be a big problem for individual services…
- If resilience demands twinning and ‘mirroring’, with backups and duplication in multiple data centres, and with it a potential doubling or tripling of carbon footprint, it can bring about tension with the goal of reducing carbon. How do we manage these tensions?

Join +2000 responsible readers

Green IO newsletter
Once a month, carefully curated news on digital sustainability and Green IO contents delivered in your mailbox